The year is 2021. The S&P 500 has just closed at another all-time high. A friend tells you about a cryptocurrency that has gone up 1,000% in six months. Your neighbor bought a house for fifty thousand dollars over the asking price and feels lucky to have gotten it. Your uncle, who has never owned a stock in his life, is day trading options on his phone. You feel like a genius just for having a 401(k). This is a bull market.
The year is 2022. The S&P 500 falls twenty percent in nine months. That cryptocurrency your friend loved is down eighty percent. Your neighbor’s house is now worth less than he paid for it. Your uncle has stopped talking about his trading account. You stop checking your 401(k) balance because it is too painful. This is a bear market.
The difference between these two environments is not just a matter of degrees on a chart. It is a difference in psychology, strategy, risk tolerance, and survival. Understanding bull vs bear markets: key differences explained is not an academic exercise. It is the difference between growing your wealth and watching it evaporate.
In this comprehensive guide, we will dissect exactly what defines each market type, how to identify when one is ending and the other is beginning, how to position your portfolio for each environment, and—most critically—how to avoid the psychological traps that cause investors to buy at the top and sell at the bottom.
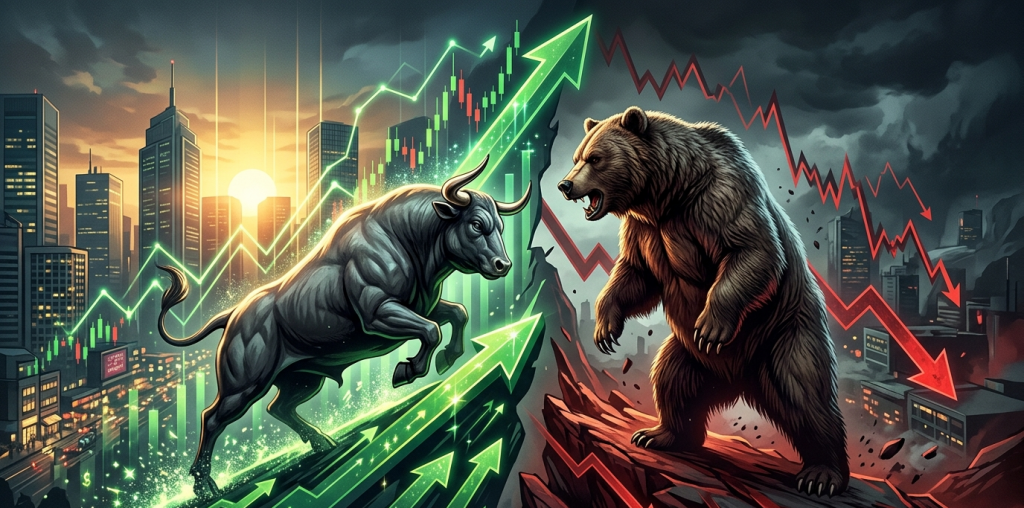
The Technical Definition: What Actually Makes a Bull or Bear Market
The financial media throws around the terms “bull market” and “bear market” constantly, often incorrectly. A 5% decline is a correction, not a bear market. A 10% rally from a low is a bounce, not a new bull market. Precise definitions matter because the strategies that work in one environment are disastrous in the other.
A bear market is officially defined as a decline of 20% or more from a recent peak, measured from closing price to closing price. The decline must be broad-based, meaning most stocks are falling, not just a few. And the decline must persist for more than a few weeks. A crash is a sharp, sudden decline. A bear market is a prolonged, grinding decline.
A bull market is defined as a rise of 20% or more from a recent bottom, again measured from closing price to closing price. Like bear markets, bull markets are broad-based and persistent. They are characterized by optimism, rising valuations, and a willingness to take risk.
The table below summarizes the key differences between bull and bear markets across multiple dimensions.
| Characteristic | Bull Market | Bear Market |
|---|---|---|
| Price movement | Rising, with higher highs and higher lows | Falling, with lower highs and lower lows |
| Duration | Typically 3-5 years | Typically 9-18 months |
| Average total return | +150% from trough to peak | -35% from peak to trough |
| Investor psychology | Optimism, greed, fear of missing out | Pessimism, fear, panic, capitulation |
| Valuation levels | Expanding P/E ratios, above historical averages | Contracting P/E ratios, below historical averages |
| Media coverage | Positive, encouraging investment | Negative, warning of further declines |
| IPO activity | High, many companies going public | Low, few companies willing to debut |
| Volatility (VIX) | Low to moderate (12-20) | High to extreme (25-40+) |
| Trading volume | Moderate, rising on up days | High, rising on down days |
| Best strategy | Buy and hold, buy dips | Reduce exposure, raise cash, short selling |
| Worst mistake | Selling too early, trying to time the top | Holding through the decline, catching falling knives |
This table is not just a reference. It is a diagnostic tool. If you look at the current market environment and see more characteristics from the left column, you are likely in a bull market. If you see more from the right column, you are likely in a bear market. In 2026, we see a mix. The price action is bearish, but investor psychology has not yet reached full capitulation. This mixed signal is why 2026 is so confusing.
The Psychology of Bulls: Greed, FOMO, and Euphoria
To understand bull markets, you must understand the emotional cycle that drives them. It begins with optimism, builds through excitement and thrill, peaks at euphoria, and finally cracks at complacency.
The early stage of a bull market is skepticism. The market has just bottomed. Most investors are still shell-shocked from the preceding bear market. They believe the rally is a trap, a “dead cat bounce.” They sell into strength, expecting another leg down. But the selling does not accelerate. The market absorbs the selling and continues higher.
The middle stage is the longest. Optimism turns to belief. Investors who missed the early rally start to regret their caution. They begin to buy on small dips, convinced that the trend is their friend. The financial media starts running stories about the “new bull market.” Valuations rise from cheap to fair to slightly expensive.
The late stage is the most dangerous. Belief turns to conviction turns to euphoria. Investors abandon all caution. They leverage their portfolios. They buy stocks they do not understand because they are going up. They sell their winners too early and hold their losers too long because “this time is different.” The financial media runs stories about “Dow 40,000” or “Dow 50,000.” Your barber gives you stock tips.
The end of a bull market is marked by complacency. The VIX falls to historic lows. Implied volatility is cheap. Investors stop buying protective puts because they have not needed them for years. Margin debt is at record highs. The number of bearish analysts is near zero. Then something breaks. A geopolitical shock. An unexpected Fed move. A earnings miss from a bellwether stock. The selling begins.
The 2021 bull market exhibited all these signs. The euphoria around cryptocurrencies, meme stocks, and SPACs was textbook late-cycle behavior. The VIX fell to 12. Margin debt peaked. Then inflation spiked, the Fed turned hawkish, and the 2022 bear market began.
The Psychology of Bears: Fear, Panic, and Capitulation
Bear markets are the mirror image of bull markets, but the emotions are more intense. Loss aversion makes the pain of a bear market feel twice as bad as the pleasure of a bull market.
The early stage of a bear market is denial. The market has fallen 5% to 10% from its peak. Investors believe this is a normal correction, a healthy pullback within a continuing bull market. They buy the dip. Sometimes the dip is bought successfully, and the market bounces. This creates a false sense of security. The next dip is deeper. The bounce is weaker.
The middle stage is fear. The market has fallen 15% to 20% from its peak. The technical definition of a bear market has been met. Investors who bought the dip are now underwater. They stop buying. They start selling. The financial media begins using the B-word. Analysts lower their price targets. The selling accelerates.
The late stage is panic and capitulation. The market has fallen 25% to 35% from its peak. Every rally is sold. Bad news drives prices lower. Good news is ignored. Investors sell regardless of price just to escape the pain. Volume spikes as the last holdouts throw in the towel. The VIX explodes above 30, often above 40.
The end of a bear market is marked by despair. Investors stop checking their accounts. They swear they will never buy stocks again. They tell their friends to avoid the market. Valuations are cheap. Dividend yields are high. Short interest is elevated. But no one wants to buy. Then slowly, imperceptibly, the market stops falling. A rally begins. No one believes it. It is a dead cat bounce. But this bounce does not fail. The cycle begins again.
The 2022 bear market exhibited all these signs. Denial in January and February. Fear in March and April. Panic in May and June. Capitulation in October when the S&P 500 fell to its low near 3,500. The VIX spiked above 30 multiple times. Then the rally began. No one believed it. It was a bear market rally, they said. But it was not. It was the start of the 2023-2024 bull market.
How to Identify Market Transitions
Identifying the transition from bull to bear or bear to bull is the holy grail of investing. Get it right, and you can avoid the worst losses and capture the best gains. Get it wrong, and you buy the top or sell the bottom.
No single indicator predicts transitions perfectly. But a combination of indicators can give you a probabilistic edge.
The first indicator is the 200-day moving average. In a bull market, the index stays above its 200-day moving average. In a bear market, the index stays below it. The transition occurs when the index crosses the 200-day moving average with conviction. A break below the 200-day on high volume is a warning that a bear market may be beginning. A break above the 200-day on high volume is a signal that a new bull market may be starting.
The second indicator is the yield curve. An inverted yield curve has preceded every recession and every bear market since 1970. The signal is not immediate. The inversion typically occurs twelve to twenty-four months before the bear market begins. But ignoring the yield curve is dangerous. When the curve inverts, you should begin reducing risk.
The third indicator is the advance-decline line. In a healthy bull market, most stocks are participating in the rally. The A/D line rises with the index. When the A/D line diverges—the index makes a new high, but the A/D line does not—it is a warning. Fewer stocks are driving the rally. The bull market is narrowing and may be ending.
The fourth indicator is the VIX term structure. When the VIX is in contango—near-term VIX below longer-term VIX—the market expects normal conditions. When the VIX moves into backwardation—near-term VIX above longer-term VIX—the market is in panic. A sustained period of backwardation often marks the capitulation phase of a bear market and the transition to a new bull market.
The fifth indicator is sentiment surveys. The American Association of Individual Investors runs a weekly survey of bullish, bearish, and neutral sentiment. When bullish sentiment is above 55% and bearish sentiment is below 20%, the market is likely near a top. When bearish sentiment is above 55% and bullish sentiment is below 20%, the market is likely near a bottom. Contrarian signals are among the most reliable in finance.
Sector Performance in Bulls vs Bears
Not all sectors perform the same in bull and bear markets. Understanding these patterns allows you to rotate your portfolio appropriately.
In a bull market, the best performers are high-beta sectors: technology, consumer discretionary, and communication services. These sectors have high growth rates and high valuations. They benefit from the optimism and risk appetite that characterize bull markets. They also have high duration, meaning their cash flows are far in the future. When discount rates are falling or stable, these stocks soar.
The financial sector also performs well in bull markets, especially in the early and middle stages. Banks benefit from rising loan demand, higher net interest margins, and lower credit losses. Investment banks benefit from high IPO and M&A activity.
The worst performers in a bull market are defensive sectors: consumer staples, utilities, and healthcare. These sectors are low-beta. They do not participate fully in the upside. Investors rotate out of these safe havens and into riskier assets.
In a bear market, the pattern reverses. Defensive sectors are the best performers. They do not fall as much as the overall market because their earnings are stable. People still buy toothpaste, pay their electricity bills, and take their medications regardless of the stock market. These sectors also pay reliable dividends, which become more attractive as stock prices fall.
The financial sector is often the worst performer in a bear market. Banks face rising credit losses, falling loan demand, and pressure on net interest margins. Investment banking revenues collapse. Regional banks with concentrated loan portfolios are especially vulnerable.
Technology and consumer discretionary fall somewhere in the middle. They fall more than the overall market because of their high valuations and long durations. But they do not fall as much as financials unless the bear market is accompanied by a tech bubble bursting.
The 2026 environment is unusual because energy has become a defensive sector. Oil prices are driven by geopolitics, not the economic cycle. Energy stocks have performed well even as the overall market has struggled. This is a reminder that the historical patterns are just averages. Every cycle is different.
Strategies for Bull Markets
The optimal strategy in a bull market is simple: buy and hold. Trying to time the bull market by selling before small corrections and buying back after them is a losing game. The best days in the market cluster around the worst days. If you miss the ten best days in a decade, your returns are cut in half.
In a bull market, you should be fully invested. Your cash allocation should be minimal, perhaps five percent to ten percent for dry powder. Your equity allocation should be tilted toward high-beta sectors. You should be willing to hold through 5% to 10% corrections because you know they are buying opportunities, not trend reversals.
You should use moving averages as your exit signal, not your entry signal. In a bull market, price should stay above the 50-day and 200-day moving averages. If it falls below the 200-day on high volume, that is your signal to reduce exposure. Not before.
You should avoid short selling in a bull market. The trend is your friend. Fighting the trend is a losing battle. Even overvalued stocks can become more overvalued. The short seller faces unlimited losses if the stock continues rising.
You should take profits gradually, not all at once. Set price targets. When a stock reaches your target, sell a portion, not the entire position. Let the rest ride. The bull market may carry it higher.
Strategies for Bear Markets
The optimal strategy in a bear market is preservation. Your goal is not to make money. Your goal is to lose less than the overall market. Cash is a position. Do not be afraid to hold it.
In a bear market, you should reduce your equity allocation. Raise cash to twenty percent, thirty percent, or even fifty percent depending on your risk tolerance. The cash earns interest in money market funds. It is dry powder for the opportunities that will emerge at the bottom.
You should rotate into defensive sectors. Consumer staples, utilities, and healthcare will fall less than technology and consumer discretionary. Energy may also be defensive in the current cycle. Dividends become important. A 4% dividend yield provides a buffer against falling prices.
You should use stop-losses aggressively. In a bull market, you can afford to let positions ride through pullbacks. In a bear market, a pullback can become a crash. Protect your capital. Sell when your stop is hit. You can always buy back later.
You should consider inverse ETFs or put options if you are sophisticated. These instruments profit when markets fall. But they are dangerous. Inverse ETFs have decay. Options expire worthless if you are wrong. Use them only if you understand the risks and only with small position sizes.
You should not try to catch the bottom. The bottom is only obvious in retrospect. What looks like a bottom in a bear market is often just a pause before the next leg down. Wait for confirmation. Wait for the index to reclaim its 200-day moving average. Wait for the VIX to fall below 30. Then start buying.
Historical Examples: 2000, 2008, and 2022
The 2000 dot-com bear market was driven by valuation excess. The Nasdaq traded at over 100 times earnings. Pets.com and hundreds of other unprofitable internet companies were worth billions. When the bubble burst, the Nasdaq fell nearly eighty percent from peak to trough. The bear market lasted two and a half years. The recovery took fifteen years.
The 2008 financial crisis bear market was driven by leverage. Banks had borrowed forty dollars for every one dollar of equity. When housing prices fell, the banks collapsed. The S&P 500 fell fifty-seven percent from peak to trough. The bear market lasted eighteen months. The recovery took five years.
The 2022 bear market was driven by inflation and rising rates. The Fed had kept rates at zero for too long. When inflation spiked, they were forced to hike aggressively. The S&P 500 fell twenty-five percent from peak to trough. The bear market lasted ten months. The recovery took eighteen months.
Each bear market was different. Each required a different strategy. The common thread was that investors who panicked and sold at the bottom locked in their losses. Investors who held or bought at the bottom were rewarded. Bear markets end. Bull markets follow.
The 2026 Market: Where Are We?
As of April 2026, the market is in a confusing transition zone. The S&P 500 is down approximately four percent for the year. The Nasdaq is down over eight percent. The Dow is roughly flat. This is not a bear market by the technical definition. The decline is not yet twenty percent from the peak. But it is not a bull market either.
The oil shock has created a cost-push inflation shock. The Fed is trapped. The yield curve is inverted. The VIX is elevated. These are bear market characteristics. But the economy is still growing. Unemployment is still low. Corporate earnings are still positive. These are bull market characteristics.
The most likely scenario is a prolonged sideways market. The S&P 500 may trade between 4,500 and 5,200 for the rest of 2026. This is not a bull market. It is not a bear market. It is a choppy, directionless market that will frustrate both bulls and bears.
In this environment, the best strategy is to reduce position sizes, hold more cash than usual, and wait for clarity. Do not fight the tape. Do not force trades. Let the market tell you what it is doing. When it decides, you will have the capital to act.
Conclusion
Understanding bull vs bear markets is not about predicting the future. It is about recognizing the present. It is about knowing which environment you are in so you can apply the appropriate strategy. The strategies that work in a bull market—buy and hold, leverage, high-beta sectors—are the strategies that destroy wealth in a bear market. The strategies that work in a bear market—raise cash, defensive sectors, stop-losses—are the strategies that underperform in a bull market.
The key is flexibility. Do not fall in love with a strategy. Do not become attached to a narrative. Let the market tell you where it is going. Adjust your approach accordingly. The investors who survive and thrive are not the ones who are right about the market’s direction. They are the ones who adapt when they are wrong.
In 2026, the market is sending mixed signals. The prudent investor respects both possibilities. Hold enough cash to survive a bear market. Hold enough stocks to participate in a bull market. Use stop-losses to protect your downside. And remember that every bear market in history has eventually ended. The sun always rises.
Your Next Step: Open your portfolio today. Ask yourself: Is this portfolio positioned for a bull market or a bear market? If you are not sure, you are probably overexposed. Reduce your position sizes. Raise your cash. Wait for the market to tell you which way it is going. Then act.
Disclaimer: This content is for educational purposes only and does not constitute financial advice. Bull and bear markets are inherently unpredictable. Past market cycles do not guarantee future patterns. Always use stop-losses and position sizing. Consult a licensed financial advisor before making investment decisions.